

The weekly stock projection
The projection is one row per Sales SKU and one column per week. Each cell is the projected end-of-week stock for that SKU.
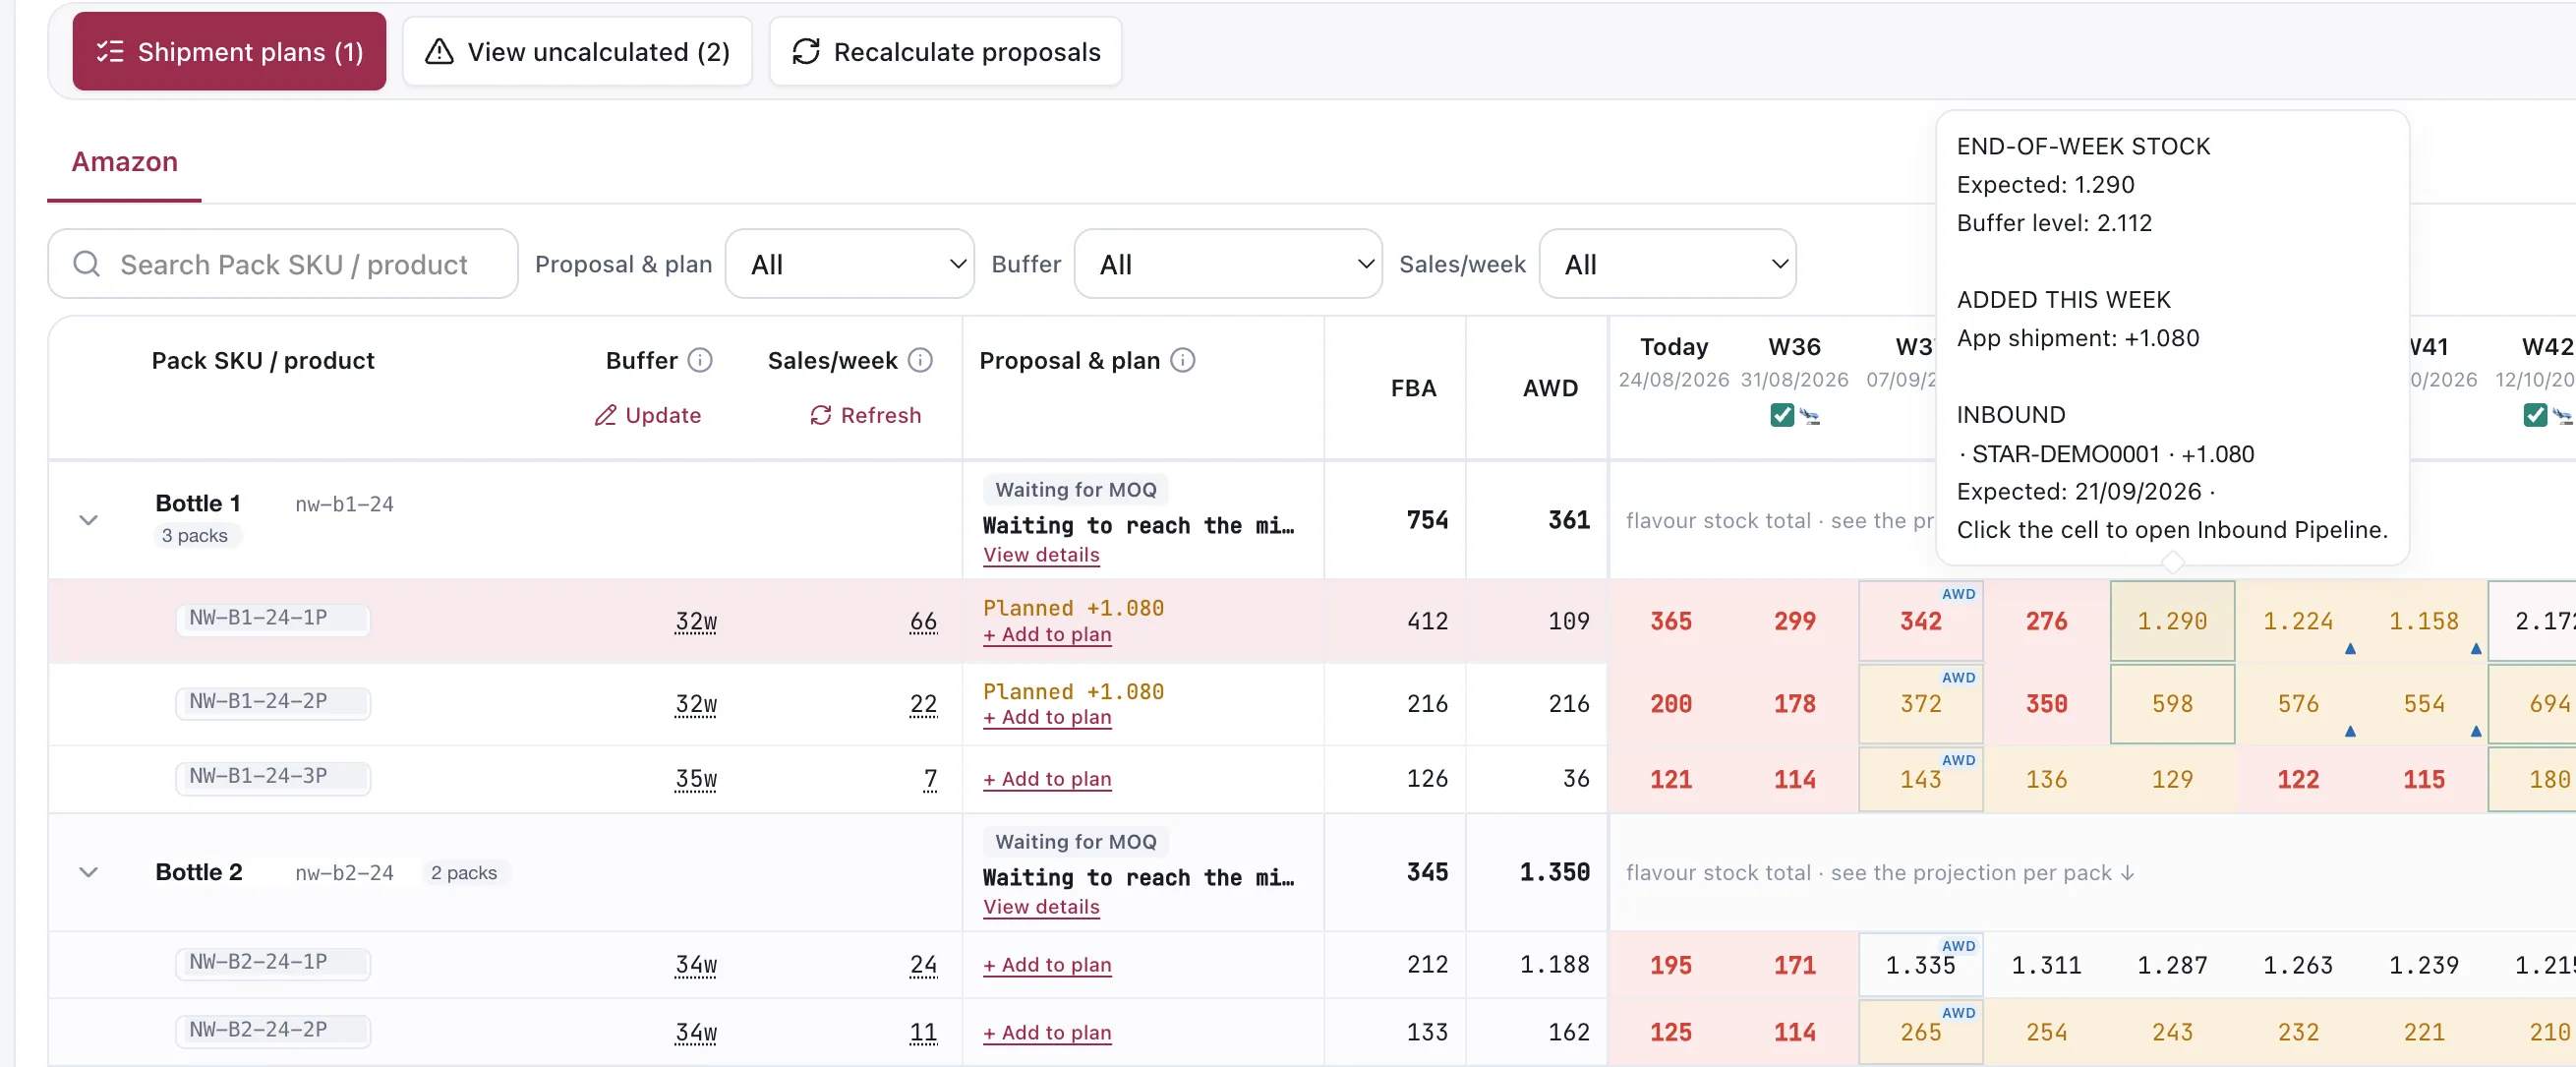
Illustrative capture of two products, six pack SKUs, and one cell opened. Visual styling may differ from the current App; the current week-cell and Coverage meanings are defined below.
The controls above the grid
Section titled “The controls above the grid”Three buttons sit above the table, each carrying a count where it has one:
- Shipment plans — opens the plans; see Order Planning.
- View uncalculated — the rows the calculation has not covered.
- Recalculate proposals — refreshes selling rates first, then rebuilds proposals. If the rate succeeds but the proposal step fails, the App keeps the new rate and tells you which step failed.
The grid shows one channel at a time: Amazon (FBA + AWD), Walmart (WFS), or TikTok (FBT). Under the buttons sit a search on Sales SKU or product and three filters: Proposal & plan, Buffer and Sales/week. On an account with a few hundred Sales SKUs those filters are how you reach the rows that need you — narrow to the ones carrying a proposal, rather than scrolling the grid looking for red.
What goes into a cell
Section titled “What goes into a cell”- What you hold in the channel’s warehouse: FBA + AWD for Amazon, WFS for Walmart, or FBT for TikTok.
- What is inbound, and the week it lands.
- The selling rate drawing it down each week.
Reading the colours
Section titled “Reading the colours”| Colour | Meaning |
|---|---|
| Normal text | At or above the SKU’s buffer, or no buffer is configured. |
| Amber text | Below the SKU’s buffer. |
| Red text | Below half of the SKU’s buffer. |
| Red background | Projected stock is zero or below. |
These week-cell colours compare projected units with the SKU’s buffer converted to units. They do not use lead time. Lead time is shown separately in the Coverage column, which reports whether current cover reaches the time needed to produce and move a new order plus your buffer.
The Coverage cell uses its own status: red for a lead-time risk, amber for a buffer gap, green when the target is covered, and purple when stock is above the target. A colour is not a shipment status; open the week cell when you need to see which lot changes the balance.
Markers on a cell
Section titled “Markers on a cell”| Marker | What it means |
|---|---|
| A ring around the cell | An inbound lot lands in this week |
| An AWD pill | Units arriving from an AWD to FBA transfer, not from a new inbound lot |
The point of the grid is the shape of the line, not any single number. A row that walks steadily down into red tells you when to act. A row that dips and recovers because a lot lands tells you that you have already acted.
The columns before the weeks
Section titled “The columns before the weeks”The columns to the left of the weeks are the row’s inputs and its current stock:
| Column | What it is | Editable |
|---|---|---|
| Buffer | The target weeks of cover for this SKU and channel | Yes — Update |
| Sales/week | The applied selling rate | Yes — Refresh recalculates it; Recalculate proposals also refreshes it first |
| Proposal & plan | Whether a proposal exists, is planned, or is waiting for a minimum | No |
| Stock | What you hold now in the selected channel’s warehouse(s) | No |
Rows are grouped by product. The group row totals the selected channel’s stock and does not project the weeks — the buffer, rate, and order quantity live on each Sales SKU, so use the SKU rows for decisions.
Opening a cell
Section titled “Opening a cell”A cell opens to show how it was arrived at:
- Expected — the projected end-of-week stock.
- Buffer level — the cover you asked to hold, for comparison.
- Added this week — what lands in that week, named: the App shipment, and the inbound lot behind it with its identifier and the date it is expected.
The panel says how to go further itself — click the cell to open Inbound Pipeline — so a number in the grid is traceable to a tracked lot rather than an assumption. An Amazon shipment that has not been reconciled remains visible as an arrival warning but is excluded from the projection until it is added to the plan.
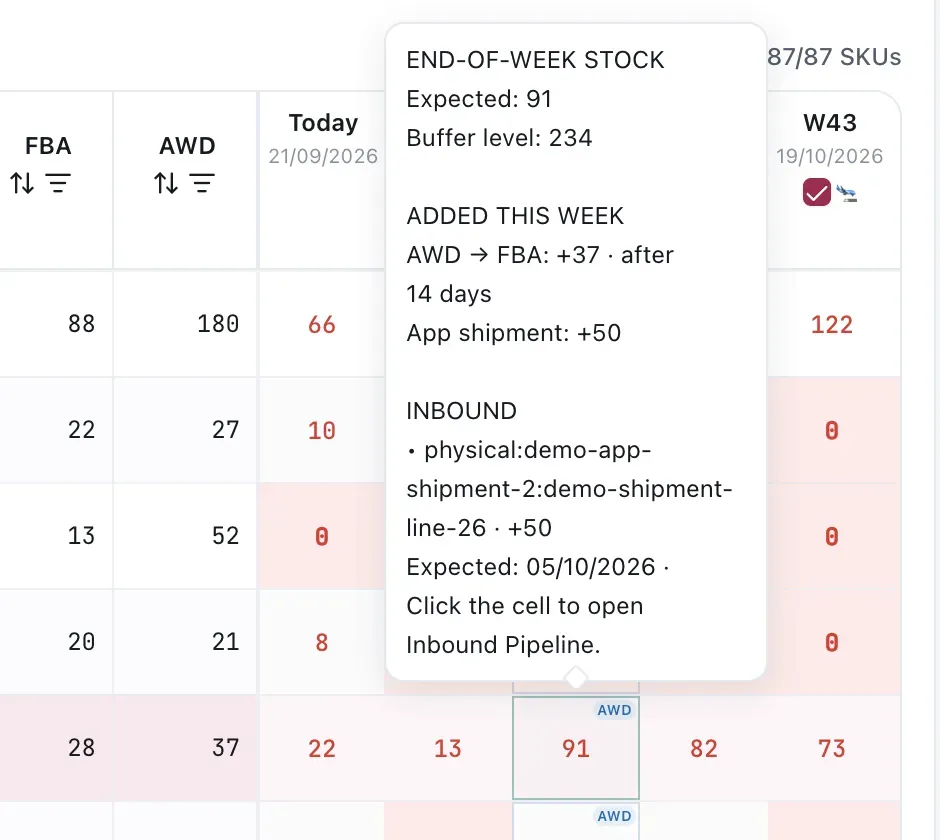
The weekly balance stays traceable to the transfer or inbound lot that changes it.
What the projection is not
Section titled “What the projection is not”It is not a forecast of demand. It projects the consequences of the currently applied rate, the stock baseline, and committed inbound. If you know demand is about to change — a promotion, a seasonal peak, or a listing going live — adjust the rate before recalculating proposals. You do not need to press Refresh separately: Recalculate proposals refreshes rates as part of the same run.
VendlenPrivacy PolicyTerms of ServiceContact
© 2026 HELODA PTE. LTD. Not affiliated with or endorsed by Amazon.