

Profit Intelligence
ACOS tells you what advertising cost against advertising sales. It does not tell you whether the product made money. In the App, this workspace is labelled Dashboard; these docs call it Profit Intelligence to describe the calculations behind it. It is where the rest of the arithmetic lives.
The three views
Section titled “The three views”The Profit dashboard is one screen with three tabs, and they answer different questions:
| Tab | Answers |
|---|---|
| Tiles | What has this period done, and which products drove it |
| P&L | Where the money went, month by month |
| Trends | Which products are moving, and in which direction |
Walmart and TikTok (Beta)
Section titled “Walmart and TikTok (Beta)”The Dashboard can show Amazon, Walmart and TikTok as separate sales channels. Walmart and TikTok support is Beta. A channel appears in the selector when that seller has an active connection in Settings › Connections. In the multi-seller Summary Dashboard, it appears when at least one seller in the selected scope has that channel; the total includes only sellers connected to it.
Choose a channel to read its own Tiles and P&L data. The channel view uses that marketplace’s sales, fees, fulfilment and cost-of-goods lines rather than putting another channel’s numbers under an Amazon label. Trends is currently Amazon-only.
Marketplace data does not arrive all at once. A recently connected channel needs time to sync, and recent periods can have incomplete settlement-based fee coverage. A period with no settlement data yet cannot show the marketplace fees that have not been reported.
From sale to net profit
Section titled “From sale to net profit”The P&L tab lays out every deduction between what a shopper paid and what you kept, one column per month.
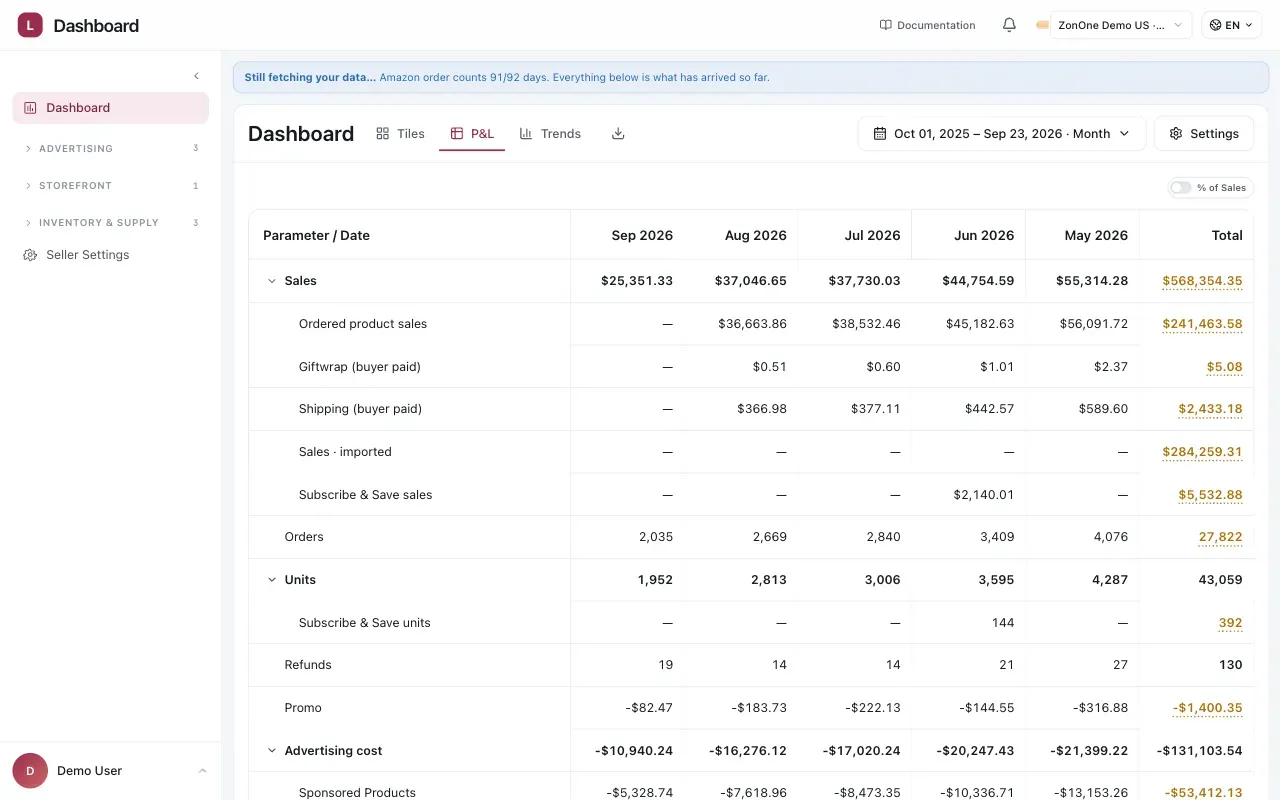
Advertising is one deduction among several, and it is the only one you change day to day.
Read down a column and the shape of the account is on one screen: Sales, then advertising, then Amazon’s fees, then what the goods cost, leaving gross profit. Indirect expenses come off that to give net profit.
Two rows are worth finding first:
- Amazon fees & transaction costs is usually the largest deduction, larger than advertising, and it is the one you have least control over.
- Cost of goods is the only figure Amazon does not supply. If it is missing, gross profit is not wrong by a little — it is wrong by the whole cost of the product. See Cost of goods.
The advertising rows are indented because they are components of the parent total: Sponsored Products, Brands, Brands Video and Display, plus an imported advertising remainder for spend that predates the Ads connection, and marketing alongside them.
Every fee on its own line
Section titled “Every fee on its own line”Amazon does not bill one fee. It bills freight, duty, storage, fulfilment, transfers, clawbacks and reimbursements under dozens of names, and collapsing them into a single number is how a product looks profitable right up until it is not.
Vendlen keeps them under the names Amazon reports them with, so you can see which one moved:
Twenty-two named lines, in six groups. Every one of them arrives from Amazon separately, and stays separate here.
Reimbursements and credits stay separate too, rather than quietly netting off a cost you never saw. A warehouse-damage reimbursement that cancels a warehouse-damage loss leaves both lines visible, which is the only way to notice the loss is recurring.
Charging Amazon MCF to the channel that sold
Section titled “Charging Amazon MCF to the channel that sold”Amazon Multi-Channel Fulfilment (MCF) is Amazon shipping an order sold on another channel. The fee is recorded in Amazon’s books, but the P&L cost belongs with the channel that made the sale.
In Dashboard › Settings, turn on Charge cross-channel fulfillment, then use Allocate fulfillment cost to to choose the channels that may receive the fee. Walmart and TikTok can be selected independently, and you can select both.
Vendlen only moves a fee when it can match an Amazon MCF shipment to an order on a selected channel by product/SKU and date within three days either way. Each unit is consumed once. A match removes that MCF fee from Amazon and places it in the selling channel’s P&L, down to the SKU. Selecting more channels widens the matching search; it does not split one fee across channels.
Anything that cannot be matched stays in Amazon and remains visible. With no recipient channel selected, the fee stays on Amazon. Turning the switch off excludes MCF from profit calculations, so check the setting before comparing periods.
The related cost of goods follows the same accounting guard: matched units are removed from Amazon’s MCF cost and represented once using the Amazon-derived MCF COGS basis in the receiving channel’s P&L. It is not counted twice.
Why ACOS is not enough
Section titled “Why ACOS is not enough”Two products, both running at 40% ACOS. One has a 55% break-even and is making money; the other has a 30% break-even and every order loses. ACOS cannot tell them apart, because it does not know what the product costs you.
That is what break-even ACOS is for, and why it sits on the Product Line rather than in a rule: it is a fact about the product, not about a campaign.
TACOS: advertising against everything
Section titled “TACOS: advertising against everything”ACOS measures ad spend against ad sales. TACOS measures ad spend against total sales, including the organic ones.
The difference matters as a product matures. Advertising that lifts organic rank looks expensive on ACOS and reasonable on TACOS, because ACOS cannot see the sales it helped produce indirectly. A falling TACOS with steady total sales usually means the organic position is doing more of the work.
Reading a period
Section titled “Reading a period”The Tiles tab summarises five periods at once — today, yesterday, and the trailing 7, 14 and 30 days — each with sales, orders, units, ad spend, estimated payout, and gross and net profit.
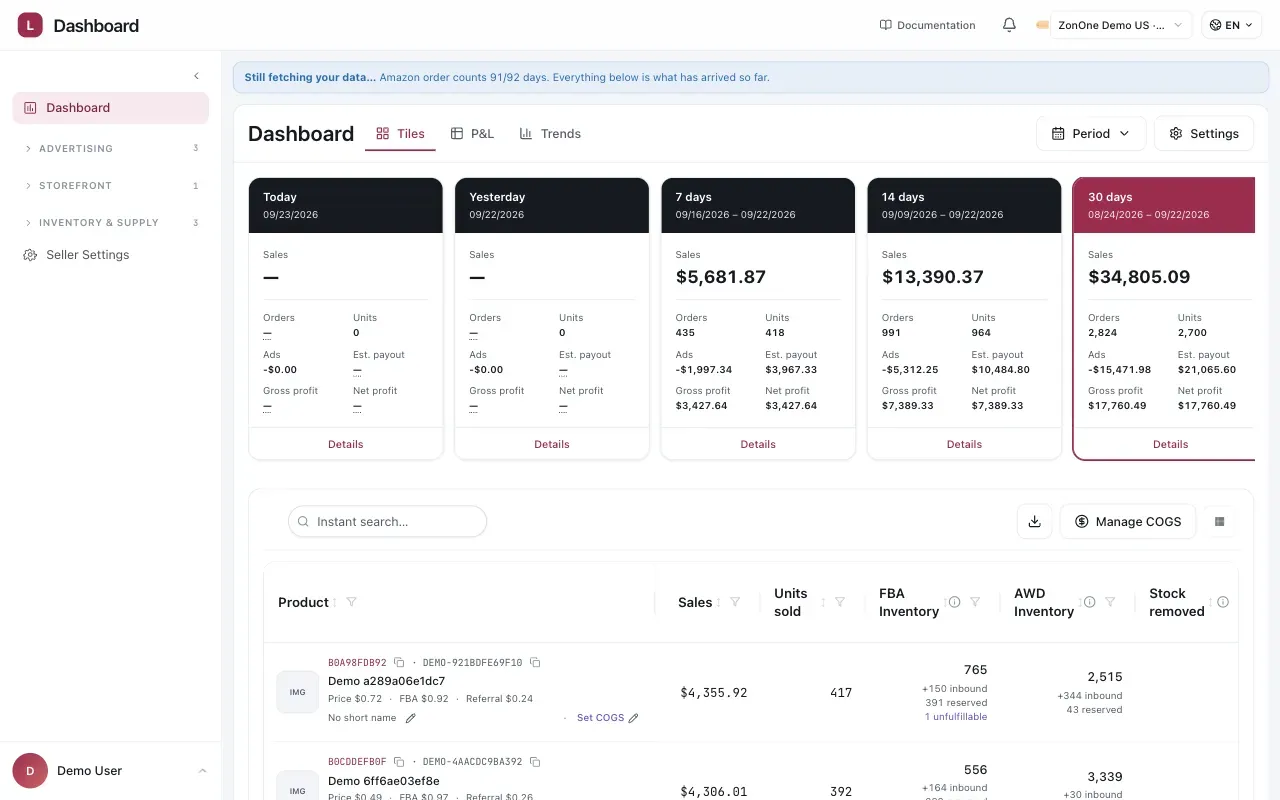
Five periods side by side. Today’s tile is a fragment of a day, not a small day.
Today is not a period. Its tile is a few hours of trading against a full day of nothing, and the profit line on it means very little. The 7, 14 and 30-day tiles are the ones to read.
Details opens the breakdown underneath the tile. Two habits are worth having.
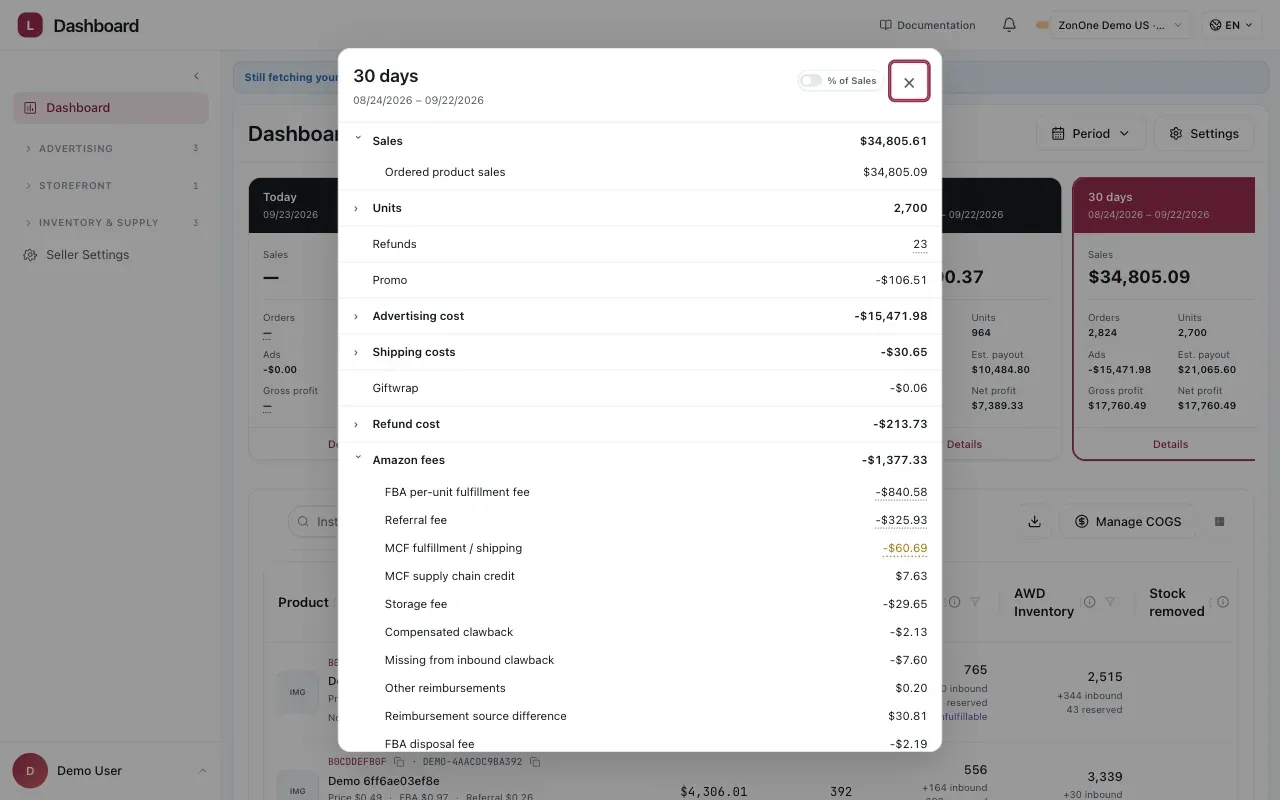
Expand a group to see the individual charges or credits behind its total.
Compare like with like. A 30-day period containing a Prime Day is not comparable to one that does not, and the conclusion you draw from the difference will be about the event, not the account.
Watch the recent edge. Amazon’s attribution keeps arriving, so the most recent days understate sales — the same lag that makes Automation ignore them. See Data Window.
The Trends tab compares complete periods product by product. Choose a metric and use the heatmap and percentage change to find movement; partial periods remain visible but do not receive a comparison.
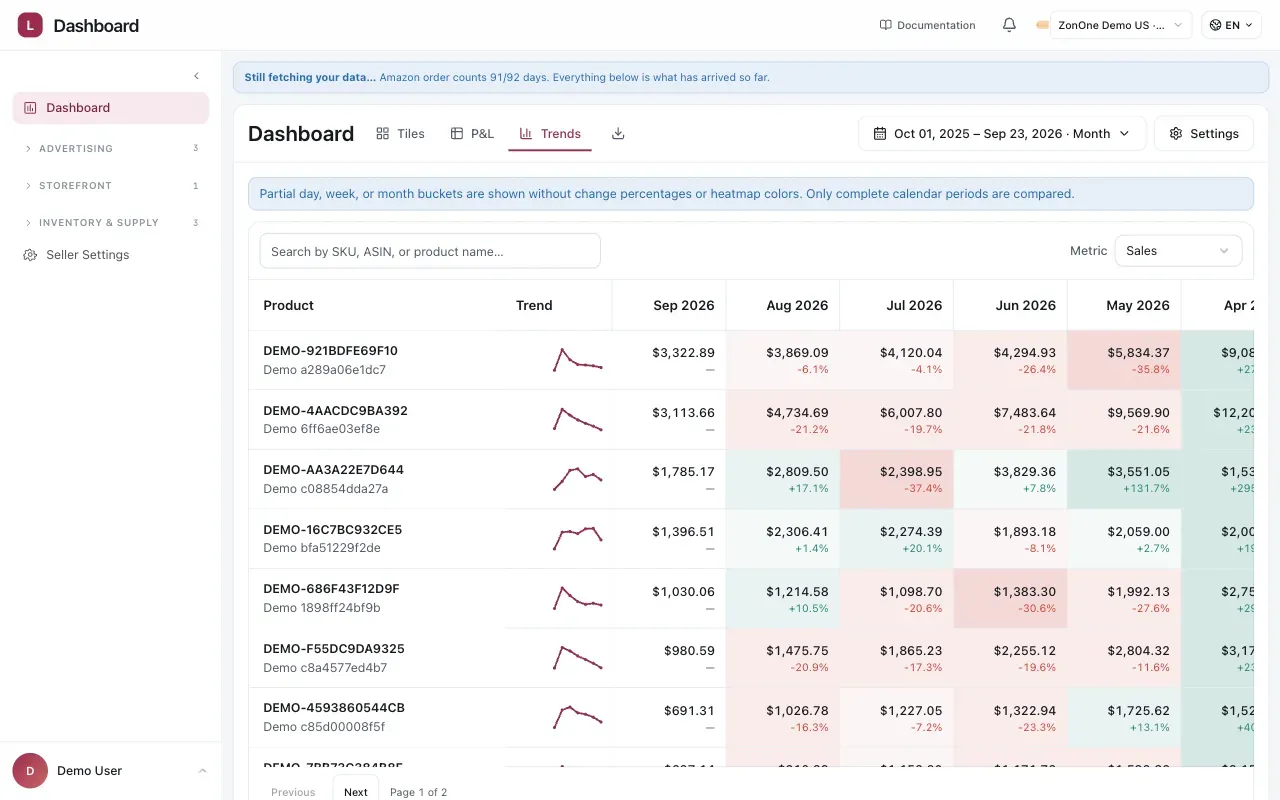
Partial periods show the value without a change percentage or heatmap colour.
Where the numbers come from
Section titled “Where the numbers come from”For Amazon, sales, fees and refunds come from the Selling Partner API connection. Walmart and TikTok figures come from their respective channel connections; settlement-based fees can lag the orders they belong to. Amazon advertising spend comes from the Amazon Ads connection, while Walmart/TikTok marketplace-reported advertising comes from each channel’s settlement data. Ads paid outside a marketplace must be entered manually. Cost of goods is the one figure the marketplaces do not have — you supply it. See Cost of goods.
A missing COGS makes every profit number wrong, not merely incomplete. If the dashboard looks implausibly healthy, that is the first thing to check.
Considerations
Section titled “Considerations”- Profit Intelligence is a separate surface from the AI Analyst. Its figures are not an input to advertising decisions; they are the context you read those decisions against.
- Fees change. Amazon revises referral and fulfilment fees, and a product that was profitable last year may not be at the same price today.
VendlenPrivacy PolicyTerms of ServiceContact
© 2026 HELODA PTE. LTD. Not affiliated with or endorsed by Amazon.