

ASIN Automation Review
Runs tell you what a rule decided. This tells you whether it helped.
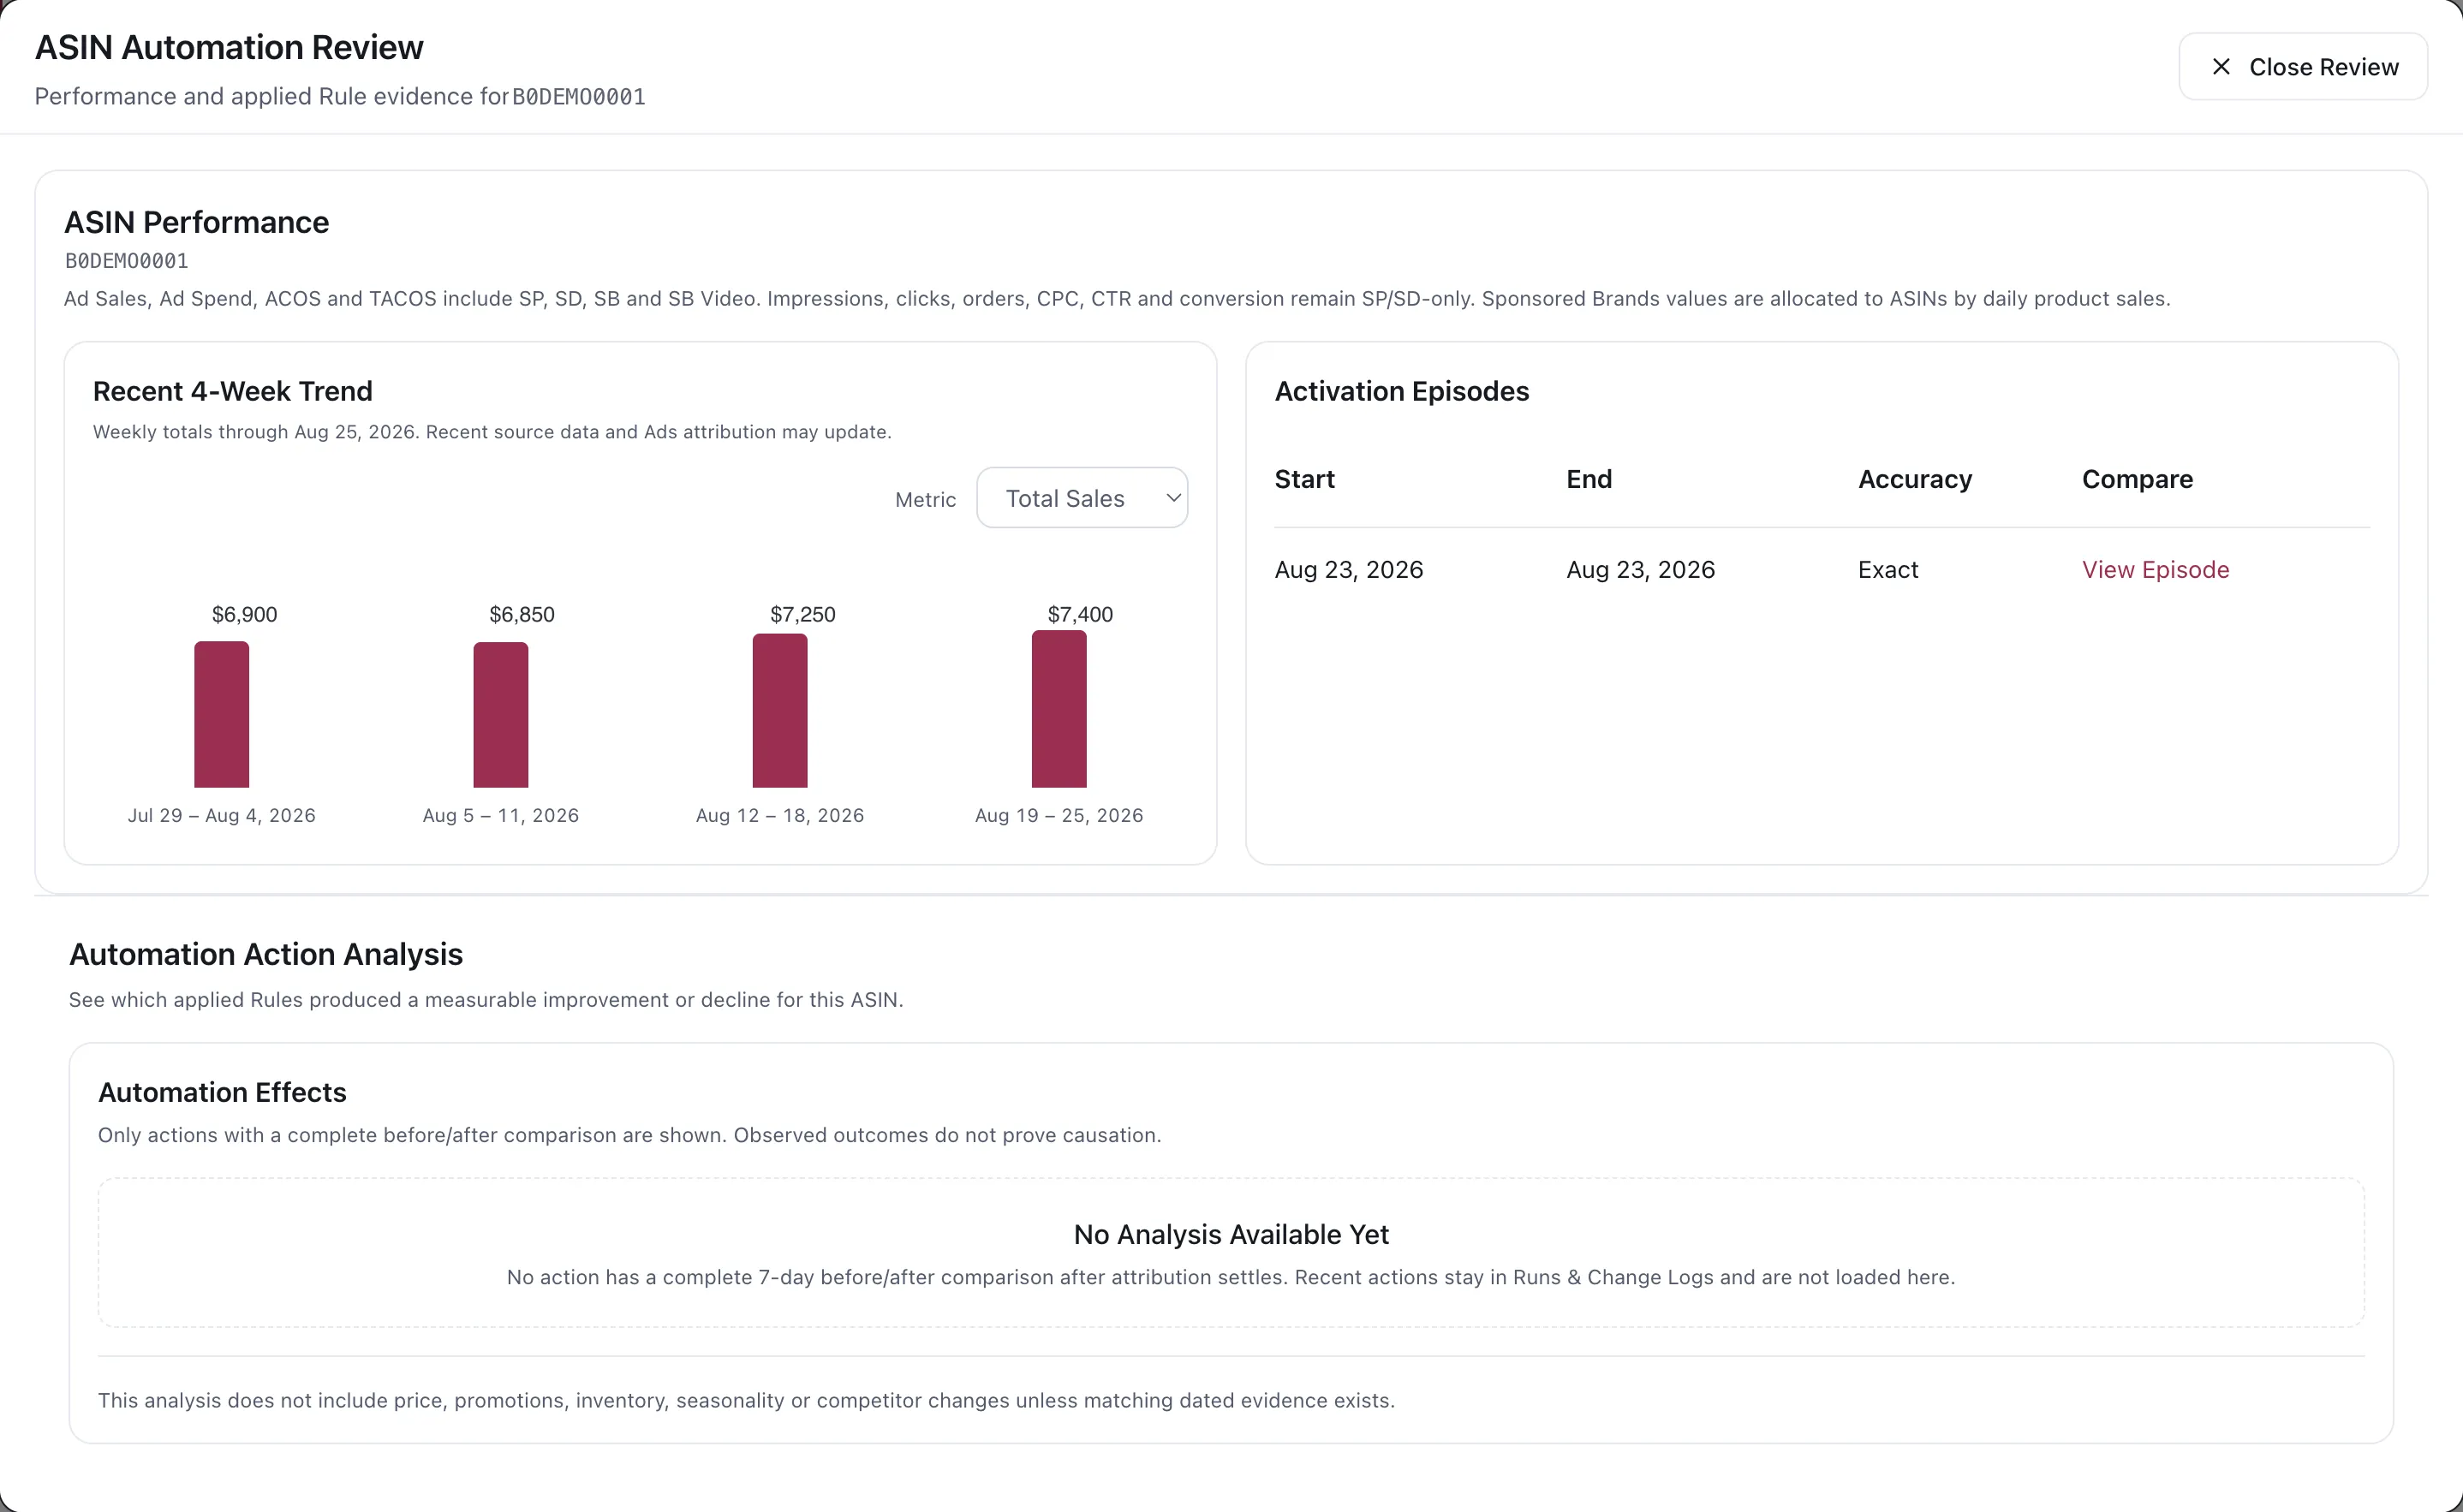
ASIN Automation Review. The identifier and figures shown are demo replacements.
The measurement note, first
Section titled “The measurement note, first”Before reading any number here, read what it covers. The two halves are not measured the same way:
| Metrics | Cover |
|---|---|
| Ad Sales, Ad Spend, ACOS, TACOS | Sponsored Products, Display, Brands and Brands Video |
| Impressions, clicks, orders, CPC, CTR, conversion | Sponsored Products and Display only |
Sponsored Brands values are allocated to ASINs by daily product sales, because a Brands campaign advertises several products at once and Amazon does not attribute its spend per ASIN.
That allocation is an estimate, and it is the reason ACOS here can differ from a per-campaign figure. Neither is wrong; they are answering different questions.
Recent trend
Section titled “Recent trend”Weekly totals for the last four weeks, with a metric selector.
Recent weeks move. Amazon’s attribution keeps arriving after the fact, so the most recent bar is the least settled. A week-on-week change of a few percent in the newest column is not yet a signal — it is the same lag that makes Automation ignore the most recent days by default. See Data Window.
Activation Episodes
Section titled “Activation Episodes”The periods this ASIN was actually under Automation, with an accuracy marker and a link into each episode.
Useful because “we turned automation on in August” is rarely precise enough. A comparison across a boundary you have mis-remembered will tell you something confident and wrong.
Automation Action Analysis
Section titled “Automation Action Analysis”This is the part worth understanding properly, because of what it deliberately does not claim.
Only complete comparisons appear
Section titled “Only complete comparisons appear”An action shows up only when it has a complete seven-day before-and-after comparison, measured after attribution has settled. Recent actions are not shown here at all — they stay in the run record until there is enough settled data on both sides to compare.
So an empty panel usually means too recent, not no effect.
Observed outcomes do not prove causation
Section titled “Observed outcomes do not prove causation”The App says this in as many words, and it is right to.
A bid went down and sales went up. Did the bid cause it? Possibly. Or a competitor went out of stock, or you ran a promotion, or the season turned, or Amazon changed something. The analysis does not include price, promotions, inventory, seasonality or competitor changes unless dated evidence for them exists.
What you are reading is a correlation with a clean before and after. That is genuinely useful — it is far better than arguing from memory — but it is evidence, not proof.
How to use it well
Section titled “How to use it well”Look for repetition, not single results. One rule that improved one ASIN once tells you almost nothing. The same rule improving twenty ASINs is a pattern worth acting on.
Be more suspicious of good news. A rule that looks like it helped is the one you will keep, so it deserves the harder question: what else changed that week?
Check the episode boundaries. If the before window includes a period when the rule was not running, the comparison is not measuring what you think.
Considerations
Section titled “Considerations”- This looks at applied actions only. A change that never reached Amazon has no after.
- An ASIN with little traffic will rarely produce a complete comparison, because seven days either side of an action may not contain enough to compare.
- For what a rule decided and why — rather than what followed — see Change History.
VendlenPrivacy PolicyTerms of ServiceContact
© 2026 HELODA PTE. LTD. Not affiliated with or endorsed by Amazon.